
Using The Dashboard Screen
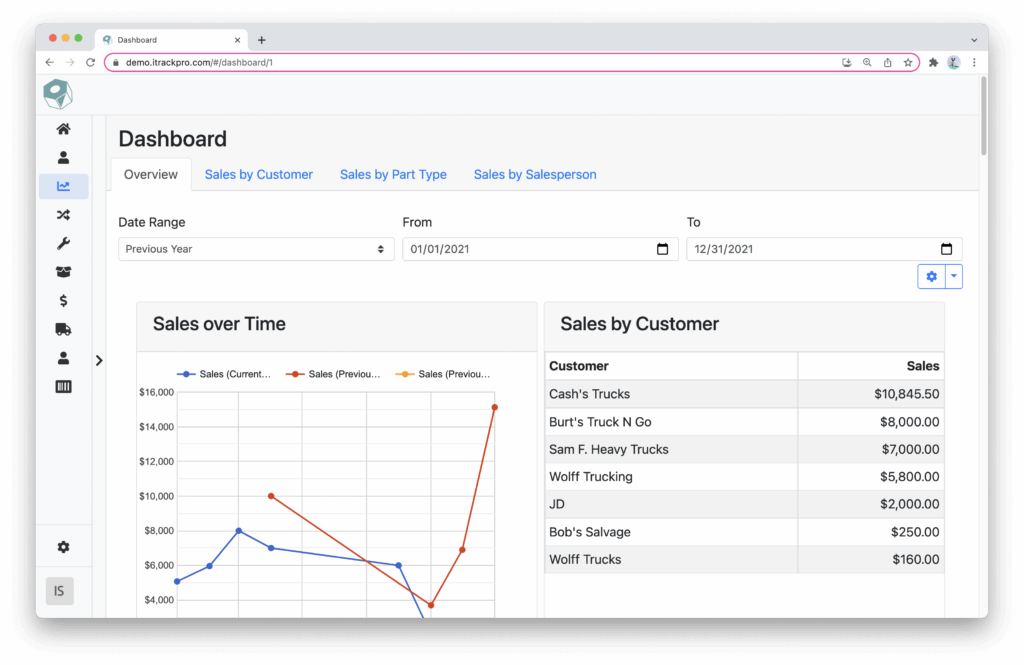
The Dashboard screen will display any reports that you have created along with the charts that are included in the reports.
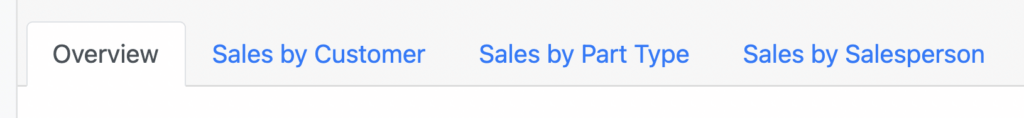
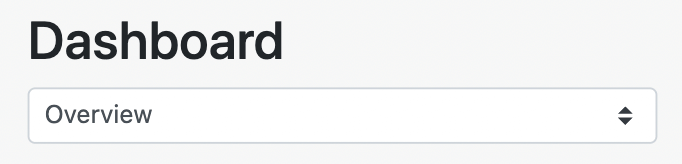
Each Report that is created will be a separate tab (or listed in a popup menu if you are on mobile).
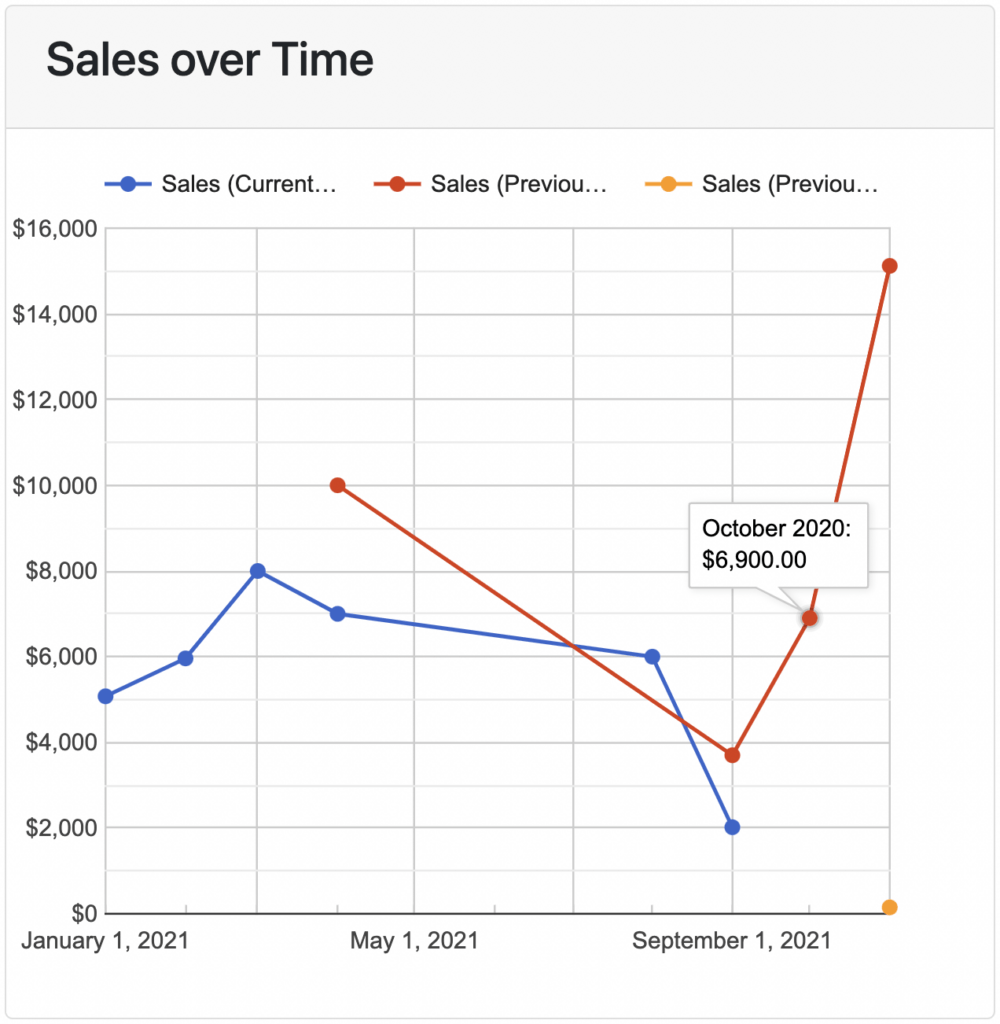
The Dashboard is not just a collection of static graphics. Each chart is interactive and dynamic, allowing you to hover or click on data points to get more information. For charts that use legends, you can click on an item in the legend to hide it from the chart.

You can change the data that you see by using the Date Range filters. By default, each chart will show data from the current year-to-date.

To create a new report or edit an existing report, click or tap the blue “gear” icon. This will take you directly to the Dashboard Configuration screen.

Clicking or tapping on the blue “arrow” icon next to it will allow you to select from the following:
- Configure Report
- Goes to the Dashboard Configuration screen
- Reload Report
- Auto-Refresh Interval
- Sets the time between each auto-refresh on the Dashboard